Estimate Your A1C Using Your Continuous Glucose Monitoring System
Even though A1C has been the gold standard in diabetes care, there is a huge limitation that this type of measurement possesses.
One of the most critical is the fact that A1C test results are considered to be an average only.
Unlike the latest studies that compare the A1C tests with the GMI (Glucose Management Indicator), GMI provides diabetic patients with an estimated level based on a continuous source of monitoring.
As a result of these averages, an individual may spend a huge amount of their time with both low and high sugar levels. Yet, still, be on target (i.e.what’s expected for most people with diabetes) with an A1C of under 7%.
Limitations of A1C
Based on these findings, it is important to note that A1C measurements are not considered to be perfect. Even though there has been quite a bit of effort in the past to reach perfection in its accuracy, these tests are still accurate within a margin of error of about 0.4 % points.
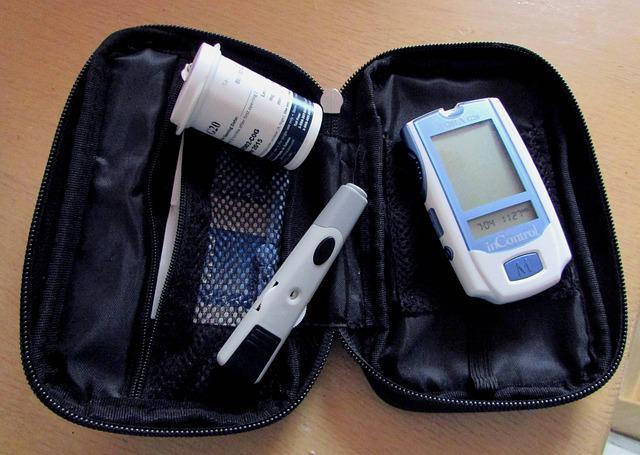
For example, these results may equate to an A1C that ranges from about 6.4% to 7.2%. Typically, for anyone who wears a CMG (Continous Glucose Monitoring System), the GMI is primarily seen as an estimate of their A1C.
Without using data from drawing blood, 14 days of data is needed to calculate the GMI. The GMI, in this case, uses an average of the person’s glucose reading to provide an estimate of their A1C.
TIR, TBR, and TAB are 3 other ways to manage glucose levels. For instance, these measurements are as follows:
- TIR (Time in Range): Glucose Levels range from 70 to 180 mg/dl
- TBR(Time below Range: Glucose Levels range below 70 mg/dl
- TBR(Time above Range: Glucose Levels range over 180 mg/dl
These measurements can be very useful in determining if a patient is actually meeting their glucose targets or if they need to be adjusted with another course of action. For instance, based on the numbers provided above, in general, an A1C of 7% or less equates to a TIR of 70% or higher.
Differences Between GMI and A1C
It normally takes about 2 to 3 months for new red blood cells to form. This is also the timeframe that A1C turnover is based on.
This is one of the primary reasons why an A1C level is only taken on a quarterly basis. The GMI, on the other hand, can be checked on a more frequent basis. This is primarily due to the fact that this indicator is based on a CGM date instead.
How Accurate is the GMI?
The answer to this question usually varies based on a number of different factors. Because the A1C on the CGM report is affected by the following information:
- Red blood cell turnover may be falsely skewed due to medical illnesses and diseases like anemia, sickle cell, genetic conditions, and other things that can affect the hemoglobin
- Chronic conditions like kidney diseases may show a false low in average A1C levels
- Blacks, Asians, and Hispanics (i.e. People of color) usually see higher levels of their A1C
- Indigenous individuals
All of these continuous glucose monitoring system factors must be taken into account before these numbers are considered to be accurate.
Real World Analysis of Glucose Monitoring System
Even though both of these measurements are being used in the real world, there is still little real data that compares both of these measurements for their comparable accuracy.
Lately, however, the University of Washington looked at the differences between A1C and how it compares to the GMI and its accuracy. The study from the University of Washington was able to identify the following data.
Between the years 2012 and 2019, 641 people with diabetes were used in a study to compare the results documented in A1C within a 30-day window before or after their healthcare visits.
This CGM report was uploaded and the information was as follows:
- The data on the CGM report had to encompass at least 14 days of information with 95% data sufficiency or more.
- The accuracy of the data was dependent upon the completion of the information supplied
The profile of the study group was as follows:
- 46 years of age was the average age of the study group
- Female population 52%
- Caucasian 93%
- Type 1 Diabetes – 91%
The Dexcom G5 was the most commonly used (i.e. calibrated 2 times daily).
However, there were other devices also used in this study, including the following:
- Dexcom G6
- Freestyle Libre
- Medtronic Enlife
- Medtronic Guardian
The CGM report was also based on the following averages:
- 24.5 days
- A1C of 7.3%.
- Mean CGM glucose equated to 162 mg/dl
Findings in the Study
The findings in this study were surprising, particularly since the discrepancies were much higher than those that were observed in previous trials. There was a huge difference between GMI and A1C.
For instance, according to this report, the researchers found the following:
- Patients with type 1 diabetes were reported as having a.17 percentage points fewer difference between A1C and GMI in comparison to patients who had type 2 diabetes.
- A .19 percent point greater difference was reported between GMI and A1C, in specific for patients who had a reduction in kidney function.
- No discrepancies were found in any specific device
Study’s Limitations
It is also important to note that the results of this study had their limitations.

Some of the most notable include:
- The population was not controlled and did not take into account outside factors (i.e. changes in meds)
- CGM dates were not parallel
- Accuracy of devices
- The quality of the Calibrations vary
Applications to the Real World
In the real world, the GMI may be able to predict what future A1C may be. However, you cannot expect a perfect match. Yet, both results could be somewhat close based on a .5 percentage. Also, during COV19, a large number of health care centers relied on GMI for their results.
It is also important to remember that both of these measurements are seen as estimated averages. Therefore, everyone needs to see each of these forms of measurement in the best context possible.
For instance, you should not be disappointed in cases where you do not reach your target. Your primary focus may need to be on the TIR (Time in Range). This is especially true if you need the extra encouragement to keep going in a positive way.